Looping and Macro in SAS and Python
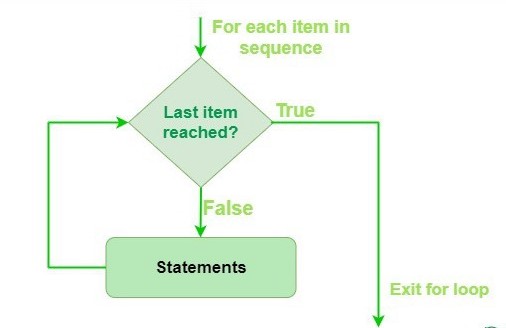
In any programming language such as C, Java, SAS, R, Python etc., we often need to perform repetitive tasks. Under this circumstance, it is difficult or impossible to do it manually because it may involve hundreds or thousands of iterations. Therefore we must use automatic loops to accomplish it. In SAS, the looping language is called macro, but they are same things actually. Macro or looping is an advanced programming in SAS, R and Python, it is necessary and very useful in real work, but it is difficult and requires a very steep learning curve.
Single Iteration Manual Loop
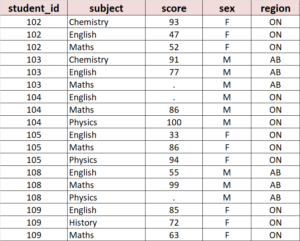
Usually, there are several different types of macro or looping. The easiest one is a single-iteration manual loop. For example, given the below example data Score with 5 columns and 18 rows.
We often need to look at the frequency distribution of variables. It is a recurring routine work. In SAS, we utilize the PROC FREQ procedure to do it, we only need to apply it to different variables. If we want, we can define a custom macro as shown below. This is merely a simple demonstration, the macro can be very complicated if you add other DATA steps or procedures to it for performing complex tasks. As shown below, the whole block will work as a new function, you can call it to apply on any variable when needed.
%macro freq(x=);
proc freq data=Score ;
tables &x;
run;
%mend;
%freq(x=subject);
%freq(x=sex);
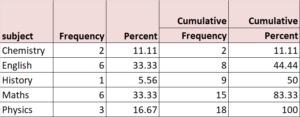
%freq(x=region);Code language: SAS (sas)For example, if we call the above macro to apply it on “subject” column, it will produce below results with a lot of information.
In the same way, we can utilize it on “sex” and “region” columns by specifying the analysis variable each time.
In Python, the equivalent part is custom function. We can define it as follows and then call it in use whenever we want. We demonstrate the syntax as below, which gives the identical results.
def freq(df, x='subject'):
    freq=pd.DataFrame({'freq' : df.groupby(x).size() } )
    freq['cumfreq']= freq['freq'].cumsum()
    freq['pct']= freq['freq']/freq['freq'].sum()
    freq['cumpct']= freq['pct'].cumsum()

    freq['pct']= round(100*freq['pct'], 2)
    freq['cumpct']= round(100*freq['cumpct'], 2)

    final=freq.loc[:, ['freq','pct','cumfreq','cumpct'] ]
    return final

freq(score, x='subject')
freq(score, x='sex')
freq(score, x='region')Code language: Python (python)
As illustrated above, this kind of loop or macro is only executed once on the specified variable, we need to specify the variable each time when we use it. This kind of manual loop or custom function is only useful for simple tasks, they are not feasible if we need a huge number of iterations. Instead, we must use the below automatic looping.
Automatic Looping
If our job requires many times of looping, we need make the looping work automatically. Usually, we can use the %DO…%TO macro loop in SAS or the for loop in Python to do it. Generally speaking, there are mainly two types of looping in our data analysis.
A. Loop over columns or variables.
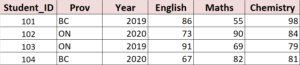
In this case, we need to perform similar analysis on different columns. For example, given below data, we need to calculate the descriptive statistics of scores of different subjects for each province.
In Python, we employ the for loop to achieve it, below is the syntax. We can use a custom list to specify the 3 analysis columns: var=df.columns.values.tolist()[3:]
Alternatively, we can use var=df.columns.values.tolist()[3:] to extract the column names from the data frame automatically. This is a better approach and it is very useful when we need to loop over a huge number of columns, which is impossible for us to prepare the variable list manually.
The next important thing in looping is: how to collect the looping results? Usually we have two options: use a list or a data frame. Personally, I prefer to use a data frame to collect all the results together. In this case, we need to start with an empty data frame and create one label variable to specify which column is used in analysis. It is the reason why we use stats=stats.assign(subject=x ). Finally, we use the append() function to concatenate the looping results into one data frame.
df = pd.DataFrame({'Student_ID': [101,102,103,104],
'Prov':['BC','ON', 'ON', 'BC'],
'Year':[2019,2020,2019, 2020],
'English': [86,73,91,67],
'Maths': [55,90,69,82],
'Chemistry':[98,84,79, 81] })
df
###### looping over analysis variable #########
var=['English', 'Maths', 'Chemistry']
var=df.columns.values.tolist()[3:]
### define an empty data frame to collect the results
results=pd.DataFrame()
### Python looping to iterate over the 3 subjects.
for x in var:
print(x)
stats=df.groupby('Prov', as_index=False)[x].agg(['size', 'min','max','mean','median'])
stats=stats.assign(subject=x ) ### create a label variable
stats=stats.loc[:, ['subject', 'size', 'min','max','mean','median']]
results=results.append(stats)
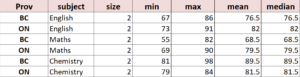
resultsCode language: Python (python)Below table shows the looping results.
In SAS, we need to use the macro programming to develop a process to fulfill the task. Please note: the underlying logic is same, we only need to use different syntax to build it. Below gives the equivalent SAS code, which yields the same results as Python code did.
proc contents data=df out=varlist(keep=name type varnum) varnum ;
run;

proc sql;
select count(*) into : N  trimmed
from varlist
where varnum>=3;

select strip(member) into :  var_1 - : var_&N
from varlist
where varnum>=3;
quit;

%macro stats;
%local I;
%do I=1 %to &N;

proc sql;
create table Stats as
select Prov,
       "&&var_&I"          as subject,
       count(*)            as size,
       min(&&var_&I)       as min,
       max(&&var_&I)       as max,
       mean(&&var_&I)      as mean,
       std(&&var_&I)       as std,
       median(&&var_&I)    as median
from df
group by Prov;
quit;

proc append base=results data=stats force;
run;
%end;
%mend;
%stats;Code language: SAS (sas)
B. Loop over different data sets or data frames
In contrast to looping over columns, the another frequent task is to loop over different data sets. As shown below, suppose we have two data frames df1 and df2 with same structure. Our job is to summarize them one by one and collect the results together.
It is important to note that we need to define a custom function with the globals() method in Python to get the data frame names. The globals() method returns the dictionary of the current global symbol table. In Python, symbol table is a data structure which contains all necessary information about the program, such as data frame names, variable names, methods, classes, functions etc. Global symbol table stores all information related to the global scope of the program, and is accessed in Python using globals() method. The functions, variables which are not associated with any class or function are stored in global scope. It is equivalent to the Dictionary and Symbol Tables in SAS, which stores all the metadata of a SAS program.
df1 = pd.DataFrame({'A': [1,1,2,2], 'B': [1,2,3,2]})
df2 = pd.DataFrame({'A': [1,1,2,2], 'B': [6,5,4,3]})
########### Get the name of a pandas DataFrame ################
### we need below custom function to get the name of a data frame using globals() macro variable.
def get_name(df):
name =[x for x in globals() if globals()[x] is df][0]
return name
############ looping process ######################
### define an empty data frame to collect the results
results=pd.DataFrame()
df_list=[df1, df2]
for df in df_list:
sum= df.groupby('A', as_index=False)['B'].agg('sum')
df_name=get_name(df)
print(df_name)
sum=sum.assign(dataframe=df_name) ### specify the input dataframe
results=results.append(sum)
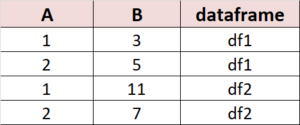
results Code language: Python (python)The above code gives below sum results.
Similarly, we can use SAS macro to build the equivalent process in SAS. It is quite easy and simple, we leave the job to our reader to exercise on it.
Summary
SAS, R and Python are the most widely used analytic tools in many industries and areas. One efficient way to learn them is to compare and connect one with another. In real work, all the data manipulation and leveraging are same, we only need to perform the same tasks with different syntax. If you get this vision in learning them, it will save you a lot of time and enable you to grasp all of them quickly and efficiently.
Responses