Home › Forums › Main Forums › Big Data › Lift curve in decile analysis
-

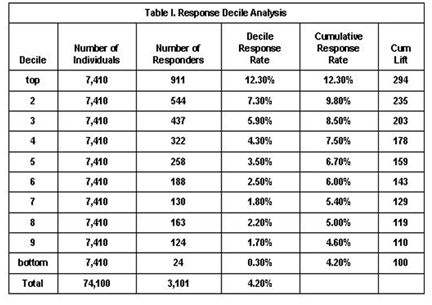
Decile analysis is widely used to assess the performance of a predictive model. Below is one decile table.
However, different people use different definitions for lift ratios. Some people just define it as:
Lift= Response rate of a decile/ the overall response rate
Use above table, the lift will be 12.30%/4.20%, 7.30%/4.20%, 5.90%/4.20%….. 0.30%/4.20%. In this case, the lift value will decrease to a limit of zero.
On the contrary, some people prefer to use cumulative response rate to define it:
Lift= Cumulative response to a decile/ the overall response rate
Then the lift will be 12.30%/4.20%, 9.80%/4.20%, 8.50%/4.20%….. 4.20%/4.20%. The lift value will decrease to 1 eventually. Above table uses this cumulative lift definition. Please note: the cumulative lift values were multiplied by 100 actually in above table.
Either one is good to use, it’s up to you to choose.
Log in to reply.